Our Engine: Explained

The mechanics behind smarter, faster, AI-ready analytics

Spontaine Solves Brittle BI and Questionable data.

From chaos to clarity — here’s how we unify your data, unlock insight, and power smarter decisions.


Spontaine is built to do what traditional BI stacks and enterprise SaaS tools struggle with: unify, structure, and activate your data for analysis, reporting, and AI : all without code or technical overhead. Here’s what happens behind the scenes:


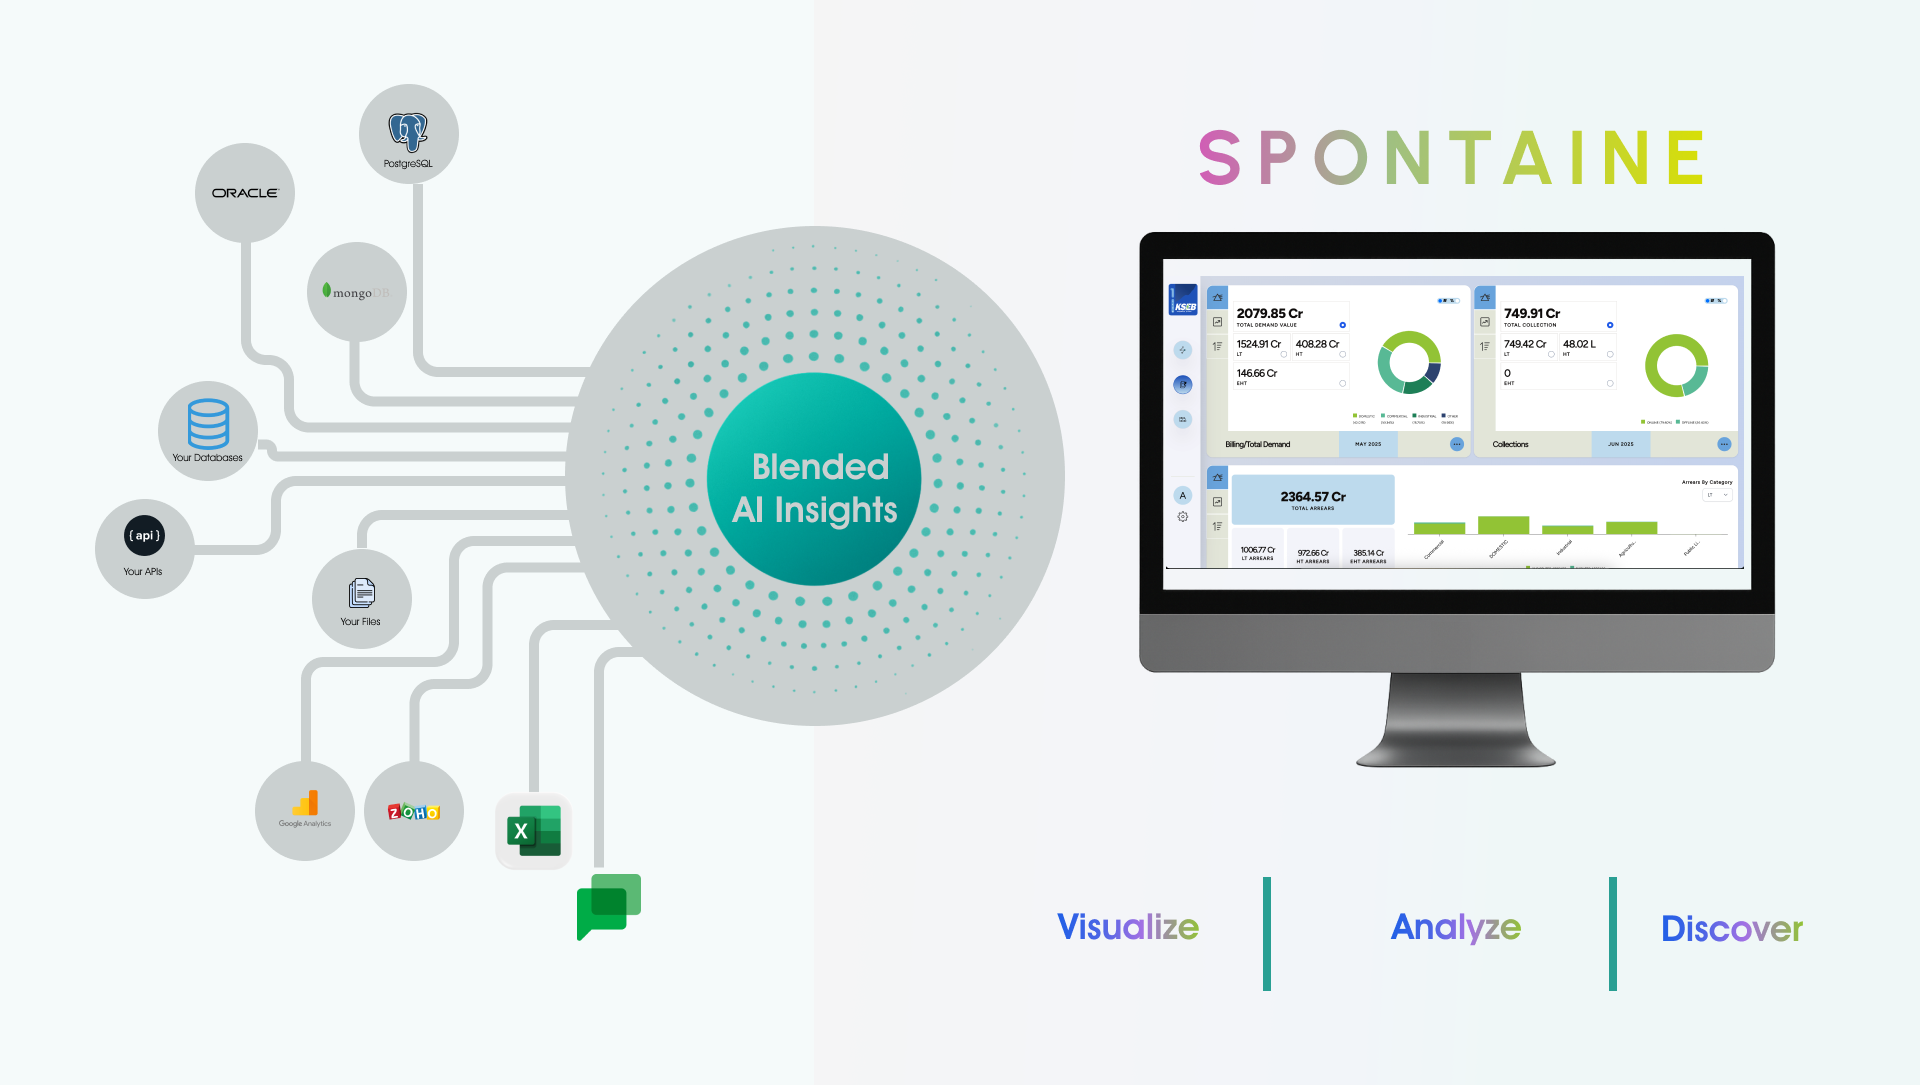
1. Connect Any Data Source

Plug in your systems. We’ll do the heavy lifting.

Spontaine integrates directly with your existing tools — ERP, CRM, HRMS, financial systems, IoT sensors, research datasets, spreadsheets, and even legacy databases.

• Prebuilt connectors for popular cloud SaaS tools

• REST APIs and secure flat file ingestion

• Real-time or scheduled syncs

• IoT & public data stream support (CSV, JSON, XML, MQTT, etc.)

No rip-and-replace. Your current stack stays in place. We just make it work together.


2. Clean & Validate the Data

Fix what’s broken. Filter what’s wrong. Trust what’s left.

Our engine automatically applies validation rules, filters, and anomaly detection to ensure your data is decision-grade.

• Rule-based validation and range checks

• Duplicate detection and source reconciliation

• AI-assisted anomaly detection (optional)

• Semantic mapping of source fields into meaningful concepSay goodbye to brittle pipelines and broken dashboards.


blend all data

3. Structure & Model for Insight


Create a semantic layer — once — and reuse it everywhere.

Using our no-code modeling interface, your team (not IT) defines KPIs, dimensions, hierarchies, and formulas. This becomes your organization’s single source of truth.

• Define reusable business logic

• Align metrics across departments

• Map to organizational taxonomies (regions, programs, themes)


This structured layer powers everything that follows.


4. Visualize & Explore

Self-service dashboards, powerful charts, and ad hoc querying.

Whether you’re a policy maker, analyst, or researcher, Spontaine lets you explore the data your way:

• Drag-and-drop dashboards with zero coding

• Prebuilt chart libraries (bar, trend, geo, heatmap, funnel, etc.)

• Filter and drill into insights in seconds

• Create data stories or embed live charts in public portals


Designed for decision-makers, not data scientists.


inferences - all channels


One data model → unlimited outputs.


5. Distribute & Automate

From private KPIs to public advisories — from reporting to AI.

Once your data is modeled, visualized, and validated, Spontaine enables real-time action:

• Public data portals & advisory CMS (for research or government use)

• PDF report generation and schedule-based distribution

• Embeddable dashboards and charts for websites

• APIs to serve structured data to AI models or external applications


Built for Everyone

Spontaine is designed to be operated by analysts, researchers, and business users — not just IT professionals.

• ✅ No-code configuration

• ✅ Role-based access and data governance

• ✅ Deploy in your private cloud or ours

• ✅ Get started in weeks, not quarters


Enterprise-Grade. Research-Ready. AI-Compatible.


Whether you’re trying to predict agricultural yields, audit your supply chain, or publish open data for transparency -  Spontaine gives you the infrastructure to do it at scale.


© Copyright 2025, All Rights Reserved